Fact sheet · 56 statistics · 49 sources opened

Readability and Plain-Language Statistics 2026

One rule governs this page: no number appears here unless a person opened the document that states it, on 23 Oct 2026. Each statistic carries its population, its year, a link to the primary source, and a line on what it does not say. Six widely repeated figures that failed that test are listed at the end so you can stop citing them.

  • Updated 24 Oct 2026
  • Verified 23 Oct 2026
  • Groups 8
  • Retired 6
  • 28%of US adults at Level 1 or below in literacy, 2023, up from 19%
  • 238 wpmaverage adult silent reading speed, non-fiction, 190 studies
  • 40%of US fourth graders below NAEP Basic in reading, 2024
  • 9%of US adults always read a privacy policy before agreeing
01
Adult literacy

Adult literacy

Measured by the OECD's Survey of Adult Skills, the US National Assessment of Adult Literacy, and the UNESCO Institute for Statistics. Scores run 0 to 500; "Level 1 or below" means below 226 points.

28%

of US adults aged 16 to 65 scored at Level 1 or below in literacy in 2023, up from 19% in 2017.

US adults 16–65, PIAAC 2023. National Center for Education Statistics, 2024

What it does not say: Level 1 or below is not illiteracy: these adults can read short, simple texts. Part of the rise reflects a redesigned 2023 assessment.

258

US average literacy score in 2023, 12 points lower than in 2017 and on par with the international average of 260.

US adults 16–65, PIAAC 2023. Institute of Education Sciences, 2024

What it does not say: The "international average" is the average of the 31 participating countries and economies, not a world average.

44%

of US adults scored at Level 3 or above in literacy, down from 48%: the share who handle long, dense texts comfortably.

US adults 16–65, PIAAC 2023. National Center for Education Statistics, 2024

What it does not say: Level 3+ in numeracy (38%) and adaptive problem solving (32%) are lower, and the numeracy change was not statistically significant.

26%

of adults across OECD countries scored at the two lowest literacy levels; 25% in numeracy, 29% in adaptive problem solving.

Adults 16–65, OECD average, 2023. OECD, 2024

What it does not say: An OECD-member average, which excludes most of the world's population.

1 in 5

adults on OECD average are low performers in all three domains at once, from 7% in Japan to 44% in Chile.

Adults 16–65, 2023. OECD, 2024

What it does not say: Low in all three domains, so smaller than the single-domain 26%. Do not add the two.

2 of 27

countries with trend data improved their average literacy since 2012: Finland (+15 points) and Denmark (+9). Fourteen saw their share of low performers rise; none saw it fall.

27 countries in both PIAAC cycles. OECD, 2024

What it does not say: Trend comparisons are made on a linked scale because the 2023 literacy test was redesigned.

53%

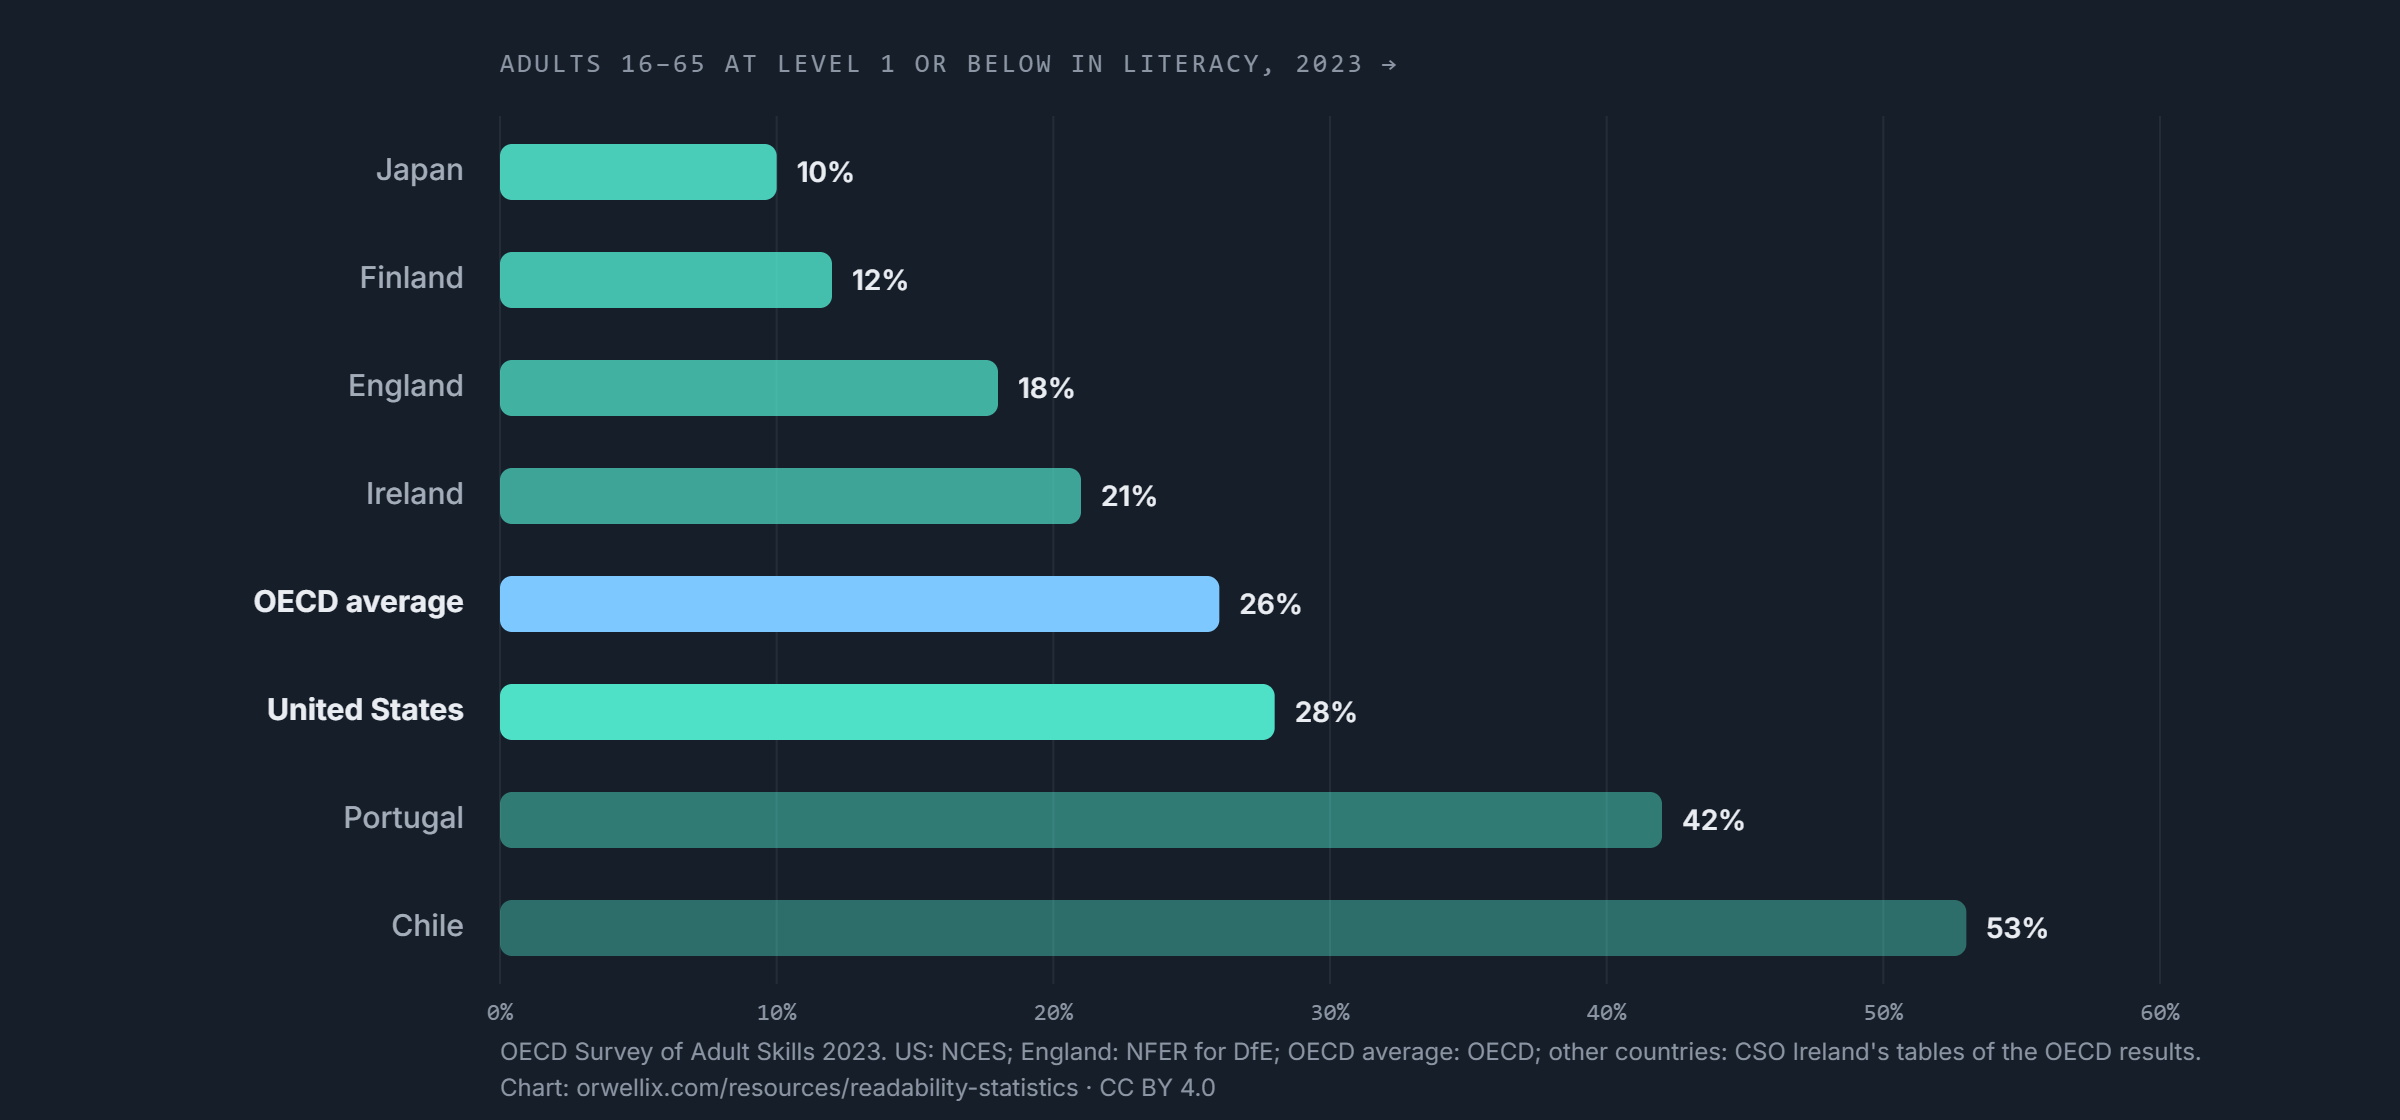
of adults in Chile scored at Level 1 or below in literacy, against 42% in Portugal, 28% in the US, 21% in Ireland, 18% in England, 12% in Finland and 10% in Japan.

Adults 16–65, 2023. Central Statistics Office, Ireland, 2024

What it does not say: Country figures are from Ireland's statistics office rendering of the OECD tables; the OECD's own HTML pages were unreachable on the day.

87.7%

of the world's adults could read and write in 2024, which leaves 739 million who cannot. 466 million of them, 63%, are women.

World population aged 15+, UIS estimates, 2024. UNESCO Institute for Statistics, 2025

What it does not say: Basic census-style literacy (a short, simple statement), mostly self-reported. Not comparable with PIAAC proficiency levels.

14%

of US adults had Below Basic prose literacy in 2003, and 43% were at Basic or below. The share at Proficient was 13%.

US adults 16+, NAAL 2003. National Center for Education Statistics, 2006

What it does not say: A 2003 snapshot on a different scale from PIAAC; 11 million adults were nonliterate in English, some of them literate in another language.

8.5 million

working-age adults in England have low literacy, low numeracy, or both, about one in five. Among 16 to 24 year olds, low literacy fell from 20% to 11% between 2012 and 2023.

Adults 16–65, England, 2023. National Foundation for Educational Research, 2026

What it does not say: England only; Scotland, Wales and Northern Ireland did not take part in PIAAC 2023. A survey estimate, not a count.

18%

of adults in England scored at Level 1 or below in literacy, better than the OECD average of 26%, with an average score of 272 against 260.

Adults 16–65, England, 2023. NFER for the Department for Education (Wheater, C., et al.), 2024

What it does not say: The National Literacy Trust converts the 18% to 6.6 million people; each UK nation defines basic literacy differently, so the four nations' figures cannot be compared.

02
Numeracy

Numeracy and problem solving

The same 2023 survey, for the skills that matter when writing includes numbers.

34%

of US adults scored at Level 1 or below in numeracy, up from 29% in 2017; the US average of 249 is below the international average of 263, and 23 countries scored higher.

US adults 16–65, PIAAC 2023. Institute of Education Sciences, 2024

What it does not say: Numeracy proficiency on everyday multi-step tasks, not school maths grades.

65%

of US adults without a high-school diploma scored at Level 1 or below in numeracy, against 16% of those with education beyond high school.

US adults 16–65, PIAAC 2023. National Center for Education Statistics, 2024

What it does not say: Education is associated with the score, not shown to cause it.

32%

of US adults scored below Level 2 in adaptive problem solving, a new 2023 domain; the US average of 247 is below the international 251.

US adults 16–65, PIAAC 2023. Institute of Education Sciences, 2024

What it does not say: Adaptive problem solving replaced the earlier "problem solving in technology-rich environments" domain, so there is no trend.

10 points

higher: the average numeracy score of men compared with women across the OECD; 16 points in England.

Adults 16–65, 2023. NFER for the Department for Education (Wheater, C., et al.), 2024

What it does not say: An average gap; the distributions overlap widely. No equivalent gap is reported for literacy.

03
Children

Children's reading

The 2024 Nation's Report Card, the US federal reading assessment of fourth and eighth graders.

40%

of US fourth graders read below the NAEP Basic level in 2024, the largest share since 2002; 23% were at or above Proficient and the average score fell to 215 from 220 in 2019.

US 4th graders, NAEP 2024. National Assessment Governing Board, 2025

What it does not say: NAEP Basic and Proficient are the assessment's own achievement levels, not "grade level"; Proficient is deliberately demanding.

33%

of eighth graders read below NAEP Basic, the largest share ever recorded; 26% were at or above Proficient.

US 8th graders, NAEP 2024. National Assessment Governing Board, 2025

What it does not say: Survey estimates with standard errors; the governing board itself rounds to "about a third".

04
Health literacy

Health literacy

The only national US measurement is from 2003 and has never been repeated. The England figures come from a 2015 study of real health materials.

36%

of US adults had Basic or Below Basic health literacy in 2003, and only 12% were Proficient. That is more than 75 million adults at Basic or below.

US adults 16+, NAAL 2003. National Center for Education Statistics (Kutner, M., et al.), 2006

What it does not say: Measured with 28 English print tasks in 2003 and never repeated nationally, so there is no newer US prevalence figure.

43%

of working-age adults in England could not fully understand text-only health materials, and 61% could not when the materials included numbers.

Adults 16–65, England; 64 health materials; skills data 2011. Rowlands, G., Protheroe, J., Winkley, J., Richardson, M., Seed, P. T., & Rudd, R., 2015

What it does not say: Compares measured skills with the demands of sampled leaflets; it is not a direct test of understanding each leaflet.

8.8 to 14.8

the range of mean Flesch-Kincaid grades across 17 studies of 1,124 patient education materials; none reached the sixth-grade level the AMA recommends.

Head and neck cancer materials, studies 1995–2024. Armache, M., et al., 2024

What it does not say: One specialty, and a range of study means rather than a pooled mean.

8th or 9th

grade: the average reading level of US adults as stated by AHRQ, which is why its toolkit recommends materials at the 4th to 6th grade level.

US adults, AHRQ guidance reviewed April 2024. Agency for Healthcare Research and Quality, 2024

What it does not say: AHRQ does not cite a measurement for the 8th-to-9th-grade figure; PIAAC does not report grades.

05
How people read

How people read

Reading speed from a 190-study meta-analysis; screen reading from 23 years of Nielsen Norman Group eye tracking; paper versus screen from three meta-analyses.

238 wpm

the average silent reading speed of adults reading English non-fiction; 260 wpm for fiction, from 190 studies and 18,573 participants.

Adult readers of English, meta-analysis. Brysbaert, M., 2019

What it does not say: Lower for children, older adults and second-language readers; not a figure for scanning web pages.

175–300

words per minute: the range most adults fall in for silent non-fiction; reading aloud averages 183 wpm.

Adult readers of English, meta-analysis. Brysbaert, M., 2019

What it does not say: A descriptive range, not a confidence interval; the often-quoted 300 wpm "normal" is an overestimate.

1,000 wpm

is impossible without severe loss of understanding; readers are unlikely to double or triple their speed, because there is a trade-off between speed and accuracy.

Review of the eye-movement literature. Rayner, K., Schotter, E. R., Masson, M. E. J., Potter, M. C., & Treiman, R., 2016

What it does not say: Skimming works for getting the gist; the claim is about reading with comprehension.

20%

of the words on an average web page are read; 28% at most if the whole visit were spent reading.

25 users, 45,237 page views, 2008. Nielsen, J., 2008

What it does not say: Modelled from time on page at an assumed reading speed, not measured by eye tracking, and from desktop browsing in 2008.

79%

of test users always scanned a new page; 16% read word by word. Concise, scannable, objective copy tested 124% better for usability.

NN/g user tests, 1997. Nielsen, J., 1997

What it does not say: A 1997 study; the article does not state its sample size.

232 users

produced the F-shaped reading pattern in 2006, and eye tracking eleven years later found it "alive and well", including on mobile.

NN/g eye tracking, 2006 and 2017. Pernice, K., 2017

What it does not say: The F pattern shows up mainly on unformatted walls of text; well-structured pages produce other scanning patterns.

57%

of page-viewing time is spent above the fold, 74% within the first two screenfuls and 81% within three.

120 participants, 130,000+ fixations, 2018. Fessenden, T., 2018

What it does not say: Share of viewing time, not share of users who scroll; search results pages are even more top-heavy.

10–20 s

is when most web page visits are abandoned; those who stay past about 30 seconds often stay two minutes or more.

205,873 pages, 2 billion visits, Microsoft Research 2010. Nielsen, J., 2011

What it does not say: Dwell time on desktop in 2010, not reading or attention as such.

g = −0.21

paper beats screen for reading comprehension by a small effect across 54 study designs and 171,055 participants, and the gap grew between 2000 and 2017.

Meta-analysis of studies 2000–2017. Delgado, P., Vargas, C., Ackerman, R., & Salmerón, L., 2018

What it does not say: No paper advantage for narrative texts or self-paced reading; the effect is for informational texts under time pressure.

g = −0.25

lower reading performance on screens in 33 experiments with 2,799 participants, limited to expository text, with no difference in reading time.

Random-assignment experiments 2008–2018. Clinton, V., 2019

What it does not say: Experiments only, so a much smaller sample than the Delgado meta-analysis.

+3 points

comprehension on phones was about the same as on desktop, three points higher and not practically different, though hard text was read about 30 ms per word more slowly on mobile.

276 participants, 1,629 article readings, 2016. Moran, K., 2016

What it does not say: Supersedes NN/g's own 2011 claim that mobile content is "twice as difficult".

91%

of US adults own a smartphone, and 16% rely on it alone for internet access, rising to 24% of 18 to 29 year olds.

5,511 US adults, Pew NPORS 2026. Pew Research Center, 2026

What it does not say: Ownership and dependence, not time spent reading on phones.

88%

of US adults get news on a digital device at least sometimes, 59% often; only 6% often get it from print.

5,166 US adults, Pew ATP, August 2026. Pew Research Center, 2026

What it does not say: News only, and "digital device" pools phones with computers and tablets.

8.97 s

the average time an email was open in 2022, down from 13.4 seconds in 2018.

Litmus Email Analytics, 17% of about 12 billion tracked opens. Litmus, 2022

What it does not say: Time open in a tracked client for marketing email, not reading; no open Litmus figure exists for 2023 to 2025.

06
Plain language

Plain language, measured

What happened when documents were rewritten, and how clear the documents are that governments send.

75%

more responses after one Veterans Benefits Administration letter was rewritten in plain language, in a 2,500-letter test; VBA projected savings of over $8 million.

One letter, one test mailing, 1999. National Partnership for Reinventing Government, 1999

What it does not say: One letter in 1999; the $8 million is a projection, not an audited saving.

1,100 → 200

calls a year about one revised VA form letter at one regional call center, as reported in Joseph Kimble's 2006 testimony; Navy officers read a plain-language memo 17% to 23% faster.

One VA office; older Navy study, as retold. Kimble, J., 2006

What it does not say: Kimble's retelling of the VA study with "about" figures; the raw data were not opened.

43%

of Veterans Benefits Administration development letters did not clearly explain what the claimant should do, and two thirds did not say so until at least page two.

GAO review of VBA letters, 2002. US General Accounting Office, 2002

What it does not say: A clarity audit, not a before-and-after effect; the 95% confidence interval runs from 30% to 56%.

80%

of people preferred sentences written in clear English in legal-language research cited by GOV.UK, and the preference grew with the complexity of the issue.

As cited in GOV.UK guidance. Government Digital Service, 2026

What it does not say: GOV.UK's summary of a third-party study whose sample and year are not stated on the page.

65% vs 33%

of product facts remembered after a web page was rewritten for readers, compared with the original, in an NN/g case study.

NN/g case study, as reported 2015. Nielsen, J., 2015

What it does not say: A single case study; the sample size is not given on the page.

Grade 16

the average reading level of the 159 statewide ballot measures in 2024, down from 19 in 2023; New Hampshire averaged 7 and Alabama 28.

159 ballot measures, 41 states, 2024. Ballotpedia, 2024

What it does not say: Flesch-Kincaid on ballot titles; values above about 17 have no real schooling equivalent.

1,211

state ballot questions from 1997 to 2007: the harder the language, the more voters skipped the question.

US state ballot questions, 1997–2007. Reilly, S., & Richey, S., 2011

What it does not say: Correlational; the abstract gives the direction, not an effect size.

B−

the average grade of ten federal agency service pages in the 2024 Federal Plain Language Report Card: two A's, one D, no F.

10 agency web pages, December 2024. Center for Plain Language, 2024

What it does not say: Only ten pages were graded in 2024, so grades are not comparable with earlier years that graded 20 or more agencies.

07
Must-read documents

Documents people must read

Privacy policies, consent forms and scientific abstracts, scored and surveyed.

9%

of US adults always read a privacy policy before agreeing to it; 36% never do, and of those who ever read one, 22% read it all the way through.

4,272 US adults, Pew, June 2019. Pew Research Center (Auxier, B., et al.), 2019

What it does not say: Self-reported behaviour, not comprehension; only 8% said they understand policies "a great deal".

17 minutes

to read the average privacy policy in 2021 at 250 words per minute; the average policy roughly doubled in length in ten years and quadrupled since 2000.

56,416 policies, 1996–2021. Wagner, I., 2022

What it does not say: English-language website policies, averages rather than medians, from a Wayback Machine corpus.

41.6%

of 2021 privacy policies scored below 30 on Flesch Reading Ease, the "very difficult" band; the median was 31.8 and only 6.7% cleared 45, Florida's minimum for an insurance policy.

Policies from 2021, same corpus. Wagner, I., 2022

What it does not say: Formula-based scores; the formulas disagree on the exact grade (16.7 versus 13.4 years of education).

22%

of scientific abstracts in 2015 had a Flesch Reading Ease below zero, up from 14% in 1960; readability has fallen for more than 130 years.

709,577 abstracts, 123 journals, 1881–2015. Plavén-Sigray, P., Matheson, G. J., Schiffler, B. C., & Thompson, W. H., 2017

What it does not say: Formula scores on abstracts, driven partly by growing use of general scientific jargon.

Grade 10.6

the average Flesch-Kincaid level of consent-form text provided by institutional review boards, against their own standards of grade 5 to 10.

114 US medical schools, 2003. Paasche-Orlow, M. K., Taylor, H. A., & Brancati, F. L., 2003

What it does not say: Template text, not completed consent forms; 2003 data.

08
AI and writing

AI and the state of writing

Adoption figures from Pew, Microsoft, Stanford and a corpus study of a million papers. Vendor surveys are labelled as such.

75%

of knowledge workers say they use generative AI at work, and 78% of those bring their own tools.

31,000 workers in 31 countries, Microsoft and LinkedIn, 2024. Microsoft and LinkedIn, 2024

What it does not say: A vendor survey by an AI vendor; "use" is self-reported and covers any use, not writing specifically.

34%

of US adults have used ChatGPT, double the 2023 share; 28% of employed adults have used it for work, up 20 points.

5,123 US adults, Pew, March 2025. Pew Research Center (McClain, C.), 2025

What it does not say: ChatGPT only, and "ever used".

52%

of US workers who use AI chatbots at work use them to edit written content and 47% to draft it, yet 55% of all workers rarely or never use them.

5,273 employed US adults, Pew, October 2024. Pew Research Center (Lin, L., & Parker, K.), 2025

What it does not say: The 52% and 47% are shares of chatbot users, not of all workers.

78%

of organizations reported using AI in 2024, up from 55% the year before.

Organizations worldwide, Stanford AI Index citing McKinsey. Stanford Institute for Human-Centered AI, 2025

What it does not say: Any AI in at least one business function, not generative AI alone; the survey sample is not stated on the page.

17.5%

of computer-science abstracts showed signs of LLM-modified text by February 2024, against up to 6.3% in mathematics and Nature journals.

950,965 papers, January 2020 to February 2024. Liang, W., et al., 2024

What it does not say: A statistical estimate of modified text, which includes AI editing; not a count of AI-written papers.

81%

of business people who write for work say poorly written material wastes their time, and they rate what they read 5.4 out of 10.

547 respondents, self-selected, 2016. Bernoff, J., 2016

What it does not say: A non-random sample recruited through the author's blog.

$12,506

per employee per year is what businesses risk losing to ineffective communication, by a Grammarly and Harris Poll estimate from leaders' self-reported 7.47 hours lost a week.

251 US business leaders and 1,001 knowledge workers, 2021. Grammarly and The Harris Poll, 2022

What it does not say: A vendor survey; the dollar figure is extrapolated from estimated hours, not measured.

09
The chart worth embedding

Low literacy is not a developing-world problem.

Share of adults aged 16 to 65 at Level 1 or below in literacy, from the 2023 Survey of Adult Skills. The United States sits above the OECD average; England and Finland below it.

Adults at Level 1 or below in literacy, 2023

Eight countries and the OECD average, Survey of Adult Skills (PIAAC) 2023

Share of adults aged 16 to 65 at Level 1 or below in literacy, Survey of Adult Skills 2023Japan 10%, Finland 12%, England 18%, Ireland 21%, OECD average 26%, United States 28%, Portugal 42%, Chile 53%.ADULTS 16–65 AT LEVEL 1 OR BELOW IN LITERACY, 2023 →0%10%20%30%40%50%60%Japan10%Finland12%England18%Ireland21%OECD average26%United States28%Portugal42%Chile53%OECD Survey of Adult Skills 2023. US: NCES; England: NFER for DfE; OECD average: OECD; other countries: CSO Ireland's tables of the OECD results.Chart: orwellix.com/resources/readability-statistics · CC BY 4.0
Level 1 or below means a score under 226 on the 0 to 500 scale: able to read short, simple texts but not to integrate information across a longer one. Figures: NCES (US), NFER for DfE (England), OECD (average), CSO Ireland's tables of the OECD results (other countries).
10
Retired statistics

Six numbers to stop citing.

Each of these circulates in articles about readability. We looked for the measurement behind it and report what we found.

  1. "The average attention span is 8 seconds, less than a goldfish."[27]

    No measurement exists. The figure appeared in a 2015 Microsoft Canada report as a graphic footnoted to a statistics website, not as Microsoft's finding, and King's College London's 2022 report calls it "a widespread myth". Half of UK adults believe it anyway.

  2. "People read only 20% of your content."[16]

    Real but narrower than it sounds. NN/g's 20% is a model fitted to 2008 time-on-page data from 25 users at an assumed reading speed, with 28% as the upper bound. Present it as a modelled estimate, not a measured share of words.

  3. "Sentences of 8 words are understood 100% of the time; 14 words, 90%; 43 words, under 10%."[31]

    No primary source. Every instance traces to a consultant's posts citing an unnamed, undated American Press Institute study of "410 newspapers" that the Institute's own site does not contain. The only citable sentence-length numbers are style rules such as GOV.UK's 25 words.

  4. "Mobile content is twice as difficult to understand."[23]

    Superseded by the same organisation's later research: NN/g's 2016 study of 276 participants found no practical difference in comprehension between phones and desktops.

  5. "Nearly 9 in 10 adults struggle with health literacy."[11]

    A reframing of the 2003 NAAL result that 88% of US adults scored below Proficient. Most of that 88% were Intermediate, which the survey defined as able to handle moderately complex health texts. Say 36% at Basic or below, and say 2003.

  6. "The average American reads at a 7th or 8th grade level."[47]

    Repeated by AHRQ as "8th or 9th grade" without a cited measurement. The modern adult skills surveys report proficiency levels, not school grades, so no current grade figure exists.

11
Method, limitations, data

How the numbers got here.

Method

Three researchers each took a theme and were allowed to record a figure only after opening the publishing body's own page, PDF or data table on 23 Oct 2026. Search snippets and secondary articles were used to find sources, never as the basis for a number.

  • Government and intergovernmental statistics come from NCES, IES, OECD, NFER for DfE, NAGB and UIS data services.
  • Research findings come from the papers themselves or their publisher-deposited abstracts, with the DOI.
  • Vendor surveys are included only where no independent figure exists, and are labelled.

Limitations

  • Figures that could not be opened were left out, including a widely cited consent-form study, a breast-cancer materials meta-analysis and several plain-language savings claims.
  • Country-level PIAAC shares come from Ireland's statistics office rendering of the OECD tables; the OECD's own web pages were unreachable, though its full report was.
  • The US health literacy figure is from 2003 because no national measurement has been repeated.
  • Reading-behaviour figures from Nielsen Norman Group are from the organisation's own articles, which report sample sizes but are not peer-reviewed.
12
Sources

49 documents, each one opened.

Numbers match the superscripts and the links on the cards.

  1. National Center for Education Statistics (2024). Highlights of the 2023 U.S. PIAAC results. NCES 2024-202, web report. SourceOpened 23 Oct 2026
  2. Institute of Education Sciences (2024). U.S. adults score on par with international average in literacy skills, below international average in numeracy and problem-solving skills. Press release, 10 December 2024. SourceOpened 23 Oct 2026
  3. OECD (2024). Do adults have the skills they need to thrive in a changing world? Survey of Adult Skills 2023. OECD Skills Studies, December 2024 (full report PDF). SourceOpened 23 Oct 2026
  4. Central Statistics Office, Ireland (2024). PIAAC 2023: international comparison. Country-level tables of the OECD results, 10 December 2024. SourceOpened 23 Oct 2026
  5. NFER for the Department for Education (Wheater, C., et al.) (2024). Survey of Adult Skills 2023 (PIAAC): national report for England. DfE research report RR1476, 10 December 2024. SourceOpened 23 Oct 2026
  6. National Foundation for Educational Research (2026). Young adults' skills have significantly improved since 2012, but 8.5 million adults in England still need support. Press release, 25 March 2026. SourceOpened 23 Oct 2026
  7. National Literacy Trust (2024). Adult literacy rates in the UK. SourceOpened 23 Oct 2026
  8. National Assessment Governing Board (2025). The Nation's Report Card shows declines in reading, some progress in 4th grade math. Press release, 29 January 2025; exact percentages from the NAEP Data Service. SourceOpened 23 Oct 2026
  9. UNESCO Institute for Statistics (2025). Adult literacy rate and illiterate population, world aggregates (indicators LR.AG15T99, ILLPOP.AG15T99). UIS data API, 2022 to 2024 values. SourceOpened 23 Oct 2026
  10. National Center for Education Statistics (2006). A first look at the literacy of America's adults in the 21st century. NCES 2006-470, National Assessment of Adult Literacy 2003. SourceOpened 23 Oct 2026
  11. National Center for Education Statistics (Kutner, M., et al.) (2006). The health literacy of America's adults: results from the 2003 National Assessment of Adult Literacy. NCES 2006-483. SourceOpened 23 Oct 2026
  12. Rowlands, G., Protheroe, J., Winkley, J., Richardson, M., Seed, P. T., & Rudd, R. (2015). A mismatch between population health literacy and the complexity of health information: an observational study. British Journal of General Practice, 65(635), e379–e386. doi:10.3399/bjgp15X685285 (full text). SourceOpened 23 Oct 2026
  13. Armache, M., et al. (2024). Readability of patient education materials in head and neck cancer: a systematic review. JAMA Otolaryngology–Head & Neck Surgery, 150(8), 713–724. doi:10.1001/jamaoto.2024.1569. SourceOpened 23 Oct 2026
  14. Brysbaert, M. (2019). How many words do we read per minute? A review and meta-analysis of reading rate. Journal of Memory and Language, 109, 104047. doi:10.1016/j.jml.2019.104047 (full preprint). SourceOpened 23 Oct 2026
  15. Rayner, K., Schotter, E. R., Masson, M. E. J., Potter, M. C., & Treiman, R. (2016). So much to read, so little time: how do we read, and can speed reading help?. Psychological Science in the Public Interest, 17(1), 4–34. doi:10.1177/1529100615623267 (abstract). SourceOpened 23 Oct 2026
  16. Nielsen, J. (2008). How little do users read?. Nielsen Norman Group. SourceOpened 23 Oct 2026
  17. Nielsen, J. (1997). How users read on the web. Nielsen Norman Group. SourceOpened 23 Oct 2026
  18. Pernice, K. (2017). F-shaped pattern of reading on the web: misunderstood, but still relevant (even on mobile). Nielsen Norman Group; original study Nielsen (2006). SourceOpened 23 Oct 2026
  19. Fessenden, T. (2018). Scrolling and attention. Nielsen Norman Group. SourceOpened 23 Oct 2026
  20. Nielsen, J. (2011). How long do users stay on web pages?. Nielsen Norman Group, on Liu, White & Dumais (2010), Microsoft Research. SourceOpened 23 Oct 2026
  21. Delgado, P., Vargas, C., Ackerman, R., & Salmerón, L. (2018). Don't throw away your printed books: a meta-analysis on the effects of reading media on reading comprehension. Educational Research Review, 25, 23–38. doi:10.1016/j.edurev.2018.09.003 (author-hosted full text). SourceOpened 23 Oct 2026
  22. Clinton, V. (2019). Reading from paper compared to screens: a systematic review and meta-analysis. Journal of Research in Reading, 42(2), 288–325. doi:10.1111/1467-9817.12269 (abstract). SourceOpened 23 Oct 2026
  23. Moran, K. (2016). Reading content on mobile devices. Nielsen Norman Group. SourceOpened 23 Oct 2026
  24. Pew Research Center (2026). Mobile fact sheet. 19 October 2026. SourceOpened 23 Oct 2026
  25. Pew Research Center (2026). News platform fact sheet. 19 October 2026. SourceOpened 23 Oct 2026
  26. Litmus (2022). The state of email engagement: when, where, and how people engage with email. Litmus blog and infographic, 15 November 2022. SourceOpened 23 Oct 2026
  27. King's College London, Policy Institute and Centre for Attention Studies (2022). Do we have your attention? How people focus and live in the modern information environment. Report, February 2022 (survey of 2,093 UK adults). SourceOpened 23 Oct 2026
  28. National Partnership for Reinventing Government (1999). Veterans Benefits Administration employees get Vice President Gore's Plain Language Award. 26 April 1999, archived by UNT Libraries. SourceOpened 23 Oct 2026
  29. Kimble, J. (2006). Testifying to plain language. Michigan Bar Journal, June 2006 (copy hosted by the Washington State Governor's Office). SourceOpened 23 Oct 2026
  30. US General Accounting Office (2002). Veterans Benefits Administration: clarity of letters to claimants needs to be improved. GAO-02-395, 23 April 2002. SourceOpened 23 Oct 2026
  31. Government Digital Service (2026). Use clear language. Writing to GOV.UK standards. SourceOpened 23 Oct 2026
  32. Ballotpedia (2024). 2024 statewide ballot measures written at college reading level, a three-year decline from last cycle. Ballotpedia News, 22 October 2024. SourceOpened 23 Oct 2026
  33. Reilly, S., & Richey, S. (2011). Ballot question readability and roll-off: the impact of language complexity. Political Research Quarterly, 64(1), 59–67. doi:10.1177/1065912909349629 (abstract). SourceOpened 23 Oct 2026
  34. Center for Plain Language (2024). 2024 Federal Plain Language Report Card. 16 December 2024. SourceOpened 23 Oct 2026
  35. Nielsen, J. (2015). Legibility, readability, and comprehension: making users read your words. Nielsen Norman Group. SourceOpened 23 Oct 2026
  36. Pew Research Center (Auxier, B., et al.) (2019). Americans and privacy: concerned, confused and feeling lack of control over their personal information. 15 November 2019. SourceOpened 23 Oct 2026
  37. Wagner, I. (2022). Privacy policies across the ages: content and readability of privacy policies 1996–2021. arXiv:2201.08739 (full text); later ACM Transactions on Privacy and Security, 26(3). SourceOpened 23 Oct 2026
  38. Plavén-Sigray, P., Matheson, G. J., Schiffler, B. C., & Thompson, W. H. (2017). The readability of scientific texts is decreasing over time. eLife, 6, e27725. SourceOpened 23 Oct 2026
  39. Paasche-Orlow, M. K., Taylor, H. A., & Brancati, F. L. (2003). Readability standards for informed-consent forms as compared with actual readability. New England Journal of Medicine, 348(8), 721–726 (abstract). SourceOpened 23 Oct 2026
  40. Microsoft and LinkedIn (2024). 2024 Work Trend Index annual report: AI at work is here. Now comes the hard part. 8 May 2024 (vendor survey of 31,000 knowledge workers). SourceOpened 23 Oct 2026
  41. Pew Research Center (McClain, C.) (2025). 34% of U.S. adults have used ChatGPT, about double the share in 2023. Short read, 25 June 2025. SourceOpened 23 Oct 2026
  42. Pew Research Center (Lin, L., & Parker, K.) (2025). U.S. workers are more worried than hopeful about future AI use in the workplace. 25 February 2025. SourceOpened 23 Oct 2026
  43. Stanford Institute for Human-Centered AI (2025). The 2025 AI Index report. April 2025. SourceOpened 23 Oct 2026
  44. Liang, W., et al. (2024). Mapping the increasing use of LLMs in scientific papers. arXiv:2404.01268. SourceOpened 23 Oct 2026
  45. Bernoff, J. (2016). The state of business writing 2016. WOBS LLC (independent survey, non-random sample of 547). SourceOpened 23 Oct 2026
  46. Grammarly and The Harris Poll (2022). The state of business communication 2022: the cost of poor communication. Vendor survey, 9 February 2022. SourceOpened 23 Oct 2026
  47. Agency for Healthcare Research and Quality (2024). Tool 11: assess, select, and create easy-to-understand materials. Health Literacy Universal Precautions Toolkit, 3rd edition. SourceOpened 23 Oct 2026
  48. Office of Disease Prevention and Health Promotion (2020). Health literacy in Healthy People 2030. US Department of Health and Human Services. SourceOpened 23 Oct 2026
  49. National Center for Education Statistics (2006). National Assessment of Adult Literacy: health literacy results. SourceOpened 23 Oct 2026
13
Cite and track

Cite this page.

Cite this page

APA

Orwellix. (2026). Readability and Plain-Language Statistics 2026. Orwellix. https://orwellix.com/resources/readability-statistics

Plain

Readability and Plain-Language Statistics 2026 (Orwellix, 2026): https://orwellix.com/resources/readability-statistics

First published 24 Oct 2026. Reuse the tables and charts with attribution under CC BY 4.0.

Changelog

  1. First published: 56 statistics in eight groups, six retired claims, one chart, 49 sources opened.
14
Questions

The questions these numbers answer.

01What reading level is the average adult?

No current survey reports a grade. The OECD and US adult skills surveys report proficiency levels: in 2023, 28% of US adults aged 16 to 65 were at Level 1 or below in literacy and 44% at Level 3 or above. The "8th or 9th grade" line that health guidance repeats has no cited measurement behind it. If you need a target, use the sourced ones on the Readability Score Reference page rather than an average.

02How fast do people read?

About 238 words per minute for adults reading English non-fiction silently, 260 for fiction, and 183 reading aloud, from a 2019 meta-analysis of 190 studies. Most adults fall between 175 and 300 words per minute. Anything above 1,000 words per minute is skimming, not reading with comprehension.

03Do people really read only 20% of a web page?

That figure comes from a 2008 Nielsen Norman Group model: given how long 25 users stayed on pages, they could have read about 20% of the words at a normal speed, and 28% at most. It is an estimate from time on page, not an eye-tracking count, but the scanning behaviour behind it has been confirmed repeatedly since 1997.

04Is paper better than screens for comprehension?

By a small, consistent margin for informational text: Hedges' g of about −0.21 to −0.25 across three meta-analyses, with no difference for stories and no difference in reading time. The gap grew between 2000 and 2017 in the largest analysis. On phones specifically, NN/g found comprehension about the same as on desktop.

05Where does the 8-second attention span come from?

A 2015 Microsoft Canada report reproduced it from a statistics website; it was never a measurement. King's College London's 2022 survey found that 50% of UK adults believe it and calls it a widespread myth. There are no long-term studies showing that attention spans have shrunk.

06How often is this page updated?

Twice a year, with a dated changelog. A figure is replaced when its publisher issues a newer one, and retired when it turns out to have no primary source.

All resources · What is a good readability score? · How Orwellix readability analysis works